On four consecutive Mondays between 17 August and 7 September 2026, the African share of South Africa’s daily Spotify chart went from 11.2 per cent to 15.7 per cent. It is the only one of the four charts Spotify publishes inside Africa that rose. Egypt’s fell 6.1 points, Nigeria’s fell 4.3 and Morocco’s fell 2.6. The measurement is every one of the 3,200 chart places on those four markets’ daily Top 200 across the four dates, carrying 113,847,648 streams, each credited to its lead artist’s registered country of origin.
The dates are all Mondays on purpose. Chart volume swings hard with the day of the week, and it swings hardest in the market this piece is about.
African share of Spotify's four African daily charts, four consecutive Mondays
South Africa’s numerator moved while its denominator did not#
South Africa is the only one of the four where African chart streams grew: 734,349 on 17 August, 1,010,121 on 7 September, up 37.6 per cent. Over the same three weeks the chart underneath them shrank 1.8 per cent, from 6,542,146 streams to 6,423,368. The share rose because the numerator rose against a flat denominator, which is the version of a share increase worth reporting. The count of African-origin acts holding a place went from 17 to 25.
In the other three markets the mechanism is the reverse and it is the same in each. Egypt’s African chart streams fell 17.6 per cent against a chart down 5.9 per cent. Nigeria’s fell 12.8 per cent against a chart down 7.9. Morocco’s fell 8.8 per cent against a chart down 2.5. In all three, local and African music lost charted streams faster than the chart as a whole lost them.
It is South African music, not imported African music#
The obvious counter-reading is that South Africa’s chart got more African because Afrobeats arrived, which would be a different story entirely. It did not. Splitting the African share by whether the lead artist comes from the charting market or from elsewhere in Africa, South Africa’s home-origin share went from 11.2 per cent to 15.2 per cent and the other-African share went from 0.0 per cent to 0.6 per cent. Two acts from elsewhere in Africa held a South African chart place on 7 September, against none on 17 August. The entire move, to within six tenths of a point, is South African artists on South Africa’s own chart.
Home-origin versus other-African share, four Mondays
Market
Date (Monday)
Share credited to artists from that market, %
Share credited to African artists from elsewhere, %
Morocco is the market where cross-border African music actually registers, at 4.8 per cent of the chart on 17 August falling to 3.2 per cent on 7 September. Nigeria’s is 1.6 rising to 2.1. Egypt’s is 0.0 on all four Mondays: not one artist from anywhere else in Africa held a place on Egypt’s Top 200 on any of the four dates measured.
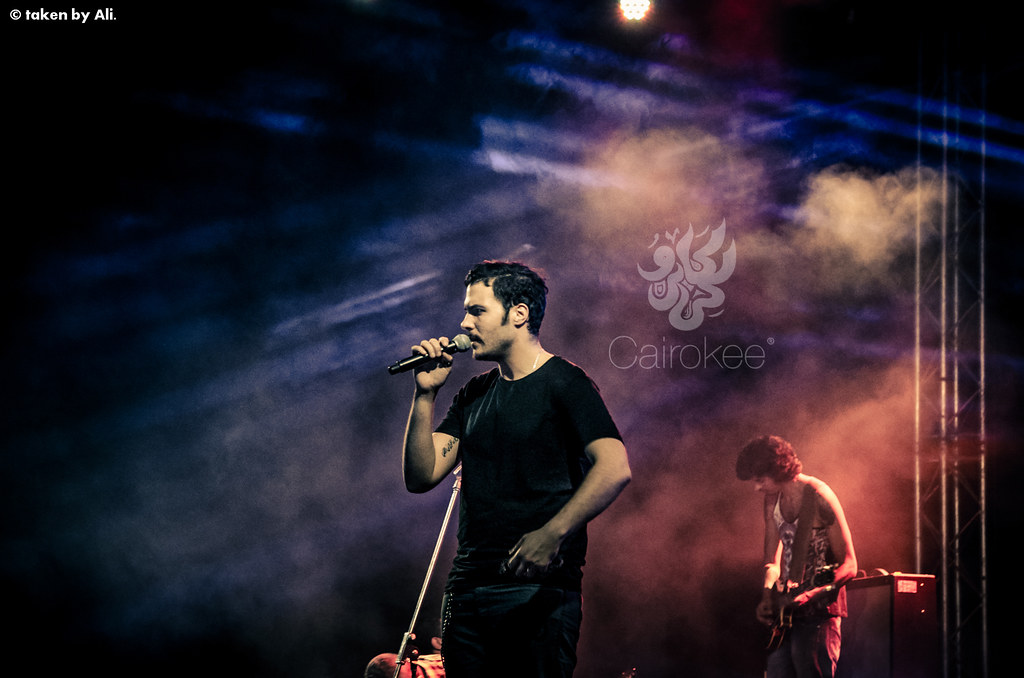
Twenty-three African-origin artists appeared on Egypt’s Top 200 on 17 August, on 7 September, or on both. Summed across only those who lost ground, the gross decline is 658,910 chart streams. Cairokee, the Cairo rock band, is 46.4 per cent of it on its own, down from 527,644 chart streams to 221,955. Adding Amr Diab, down from 338,197 to 226,317, and TUL8TE, down from 895,944 to 802,391 and still the largest single act on the chart, takes three names to 77.6 per cent of the whole decline.
South Africa’s increase has no equivalent. Across the 25 artists in its decomposition the gross increase is 296,602 chart streams and the largest single contributor, Mlindo The Vocalist, is 7.8 per cent of it. Behind it, Riky Rick contributes 21,647 chart streams, Mordecai 18,562, Tems 18,558, Samthing Soweto 18,536, Kwesta 18,303, Dlala Thukzin 18,286 and Lloyiso 18,095. Several of them held no South African chart place at all on 17 August.
It could be the day of the week. This is the objection that killed the first version of this piece. This desk’s collection began on 13 August, a Thursday, and read endpoint to endpoint from there South Africa’s share reads 9.7 per cent rising to 15.7, its African chart streams appear to grow 197.1 per cent and its chart volume appears to grow 83.9 per cent in under a month. None of that is growth. South Africa’s daily chart total across the 16 collected dates runs from 3,492,265 to 7,133,967, a spread of 104.3 per cent of the lower figure, against 24.9 per cent for Nigeria, 18.0 per cent for Egypt and 10.7 per cent for Morocco. 13 August is the lowest reading of all 16. Holding the weekday fixed removes the artefact and cuts the South African move from 6.0 points to 4.5. It does not reverse it, and the four Mondays are monotone upward.
It could be four points of noise. Four observations is a very short panel and nothing here is a significance test. The wider series is the check on direction rather than size: across all 15 date-to-date steps in the 16-date series, South Africa rose on 10 and fell on 5, while Egypt fell on 12 and rose on 2. That is weekday-neutral, because it counts direction and not magnitude.
African share of Spotify's four African daily charts, all 16 collected dates
Context, not the finding. Collection dates are unevenly spaced and chart volume moves with the weekday, so this series should be read for direction and not for endpoint change. The finding above uses the four Mondays only.
It could be one artist. For Egypt it substantially is, and that is the caveat that matters most here. Dropping Cairokee alone takes 46.4 per cent off Egypt’s gross decline; dropping the top three takes 77.6 per cent off it. South Africa’s increase survives the same treatment almost intact: dropping its largest contributor removes 7.8 per cent and dropping its top five removes 33.8 per cent.
Robustness: Egypt's decline in African chart streams, largest contributors removed
Scenario
Rows
Total
Mean
Largest row share, %
Change in total, %
Change in mean, %
All rows
23
658,910
28,648
46.39
0
0
Excluding the top 1 (Cairokee)
22
353,221
16,056
31.67
-46.39
-43.96
Excluding the top 3 (Cairokee, Amr Diab, TUL8TE)
20
147,788
7,389
18.14
-77.57
-74.21
Excluding the top 5 (Cairokee, Amr Diab, TUL8TE, ZIAD ZAZA, Donia Wael)
18
95,178
5,288
25.33
-85.56
-81.54
Source: Recomputed from egypt-chart-african-stream-change-by-artist-mondays-2026, retrieved 7 Sep 2026 · download the data
Robustness: South Africa's increase in African chart streams, largest contributors removed
Scenario
Rows
Total
Mean
Largest row share, %
Change in total, %
Change in mean, %
All rows
25
296,602
11,864
7.76
0
0
Excluding the top 1 (Mlindo The Vocalist)
24
273,575
11,399
7.91
-7.76
-3.92
Excluding the top 3 (Mlindo The Vocalist, Riky Rick, Mordecai)
22
233,366
10,608
7.95
-21.32
-10.59
Excluding the top 5 (Mlindo The Vocalist, Riky Rick, Mordecai, Tems, Samthing Sou2026)
20
196,272
9,814
9.33
-33.83
-17.28
Source: Recomputed from south-africa-chart-african-stream-change-by-artist-mondays-2026, retrieved 7 Sep 2026 · download the data
A chart snapshot cannot say why an act left the Top 200. A release ageing out, a chart reshuffle and a collection gap all look identical here, and no cause is claimed for any single movement.
The collection itself could be faulty. On 28 August the upstream feed served charts identical at every position, track and stream count to 27 August, for 44 of the 76 charts compared. Egypt was among them; Nigeria, Morocco and South Africa were not. That date is kept in the series and disclosed rather than dropped, and it is not one of the four Mondays this finding rests on.
Collection integrity check: charts served identical on 27 and 28 August 2026
Measure
Charts
Charts compared across the two dates
76
Charts identical at every position, track and stream count
The population limit stands over all of it. Spotify publishes a daily Top 200 for four countries in Africa and no others, so this is not a continental measure and cannot be made into one. A share of a Top 200 is a share of charted consumption inside that chart, not a share of a country’s listening, and an artist streamed heavily who never reaches a top 200 place is invisible to every number above.
For a Johannesburg label the number to act on is 25, against 17 three weeks earlier, on a chart whose total volume did not grow. Placement got easier to hold in absolute terms, not just relative ones, and it got easier for South African acts specifically rather than for African acts generally. The level is still the point of comparison: at 15.7 per cent South Africa’s chart remains by a wide margin the least African of the four, against 76.7 per cent in Nigeria.
For a Cairo label the number to act on is 46.4. Nearly half the fall in African chart streams on Egypt’s own chart is one band coming off a peak, which makes the headline share a poor read on local appetite by itself. Strip the top three acts out and the remaining 20 account for 147,788 streams of decline rather than 658,910. If your release planning treats Egypt’s African share as demand signal, read the decomposition first and the share second.
For an artist the content is narrower than either. Nothing here is a payout or a rate; it is chart placement, and chart placement is a sample of one day. What it says is that holding a South African top 200 place was easier in early September than in mid-August and holding an Egyptian one was harder, and that the South African opening was not driven by any single record. The panel runs weekly. The test is whether South Africa’s fourth Monday reading of 15.7 per cent survives into October, once the releases behind it age out.
We use essential cookies to run the site. With your permission we would also use analytics cookies to understand which stories are read, so we can commission more of what works. You can change your mind at any time. Cookie Policy · Privacy Policy