Sixty-five of the 75 country charts Spotify publishes carried zero artist of African origin on 27 August 2026, measured the same way this desk has measured it eight times in the past two weeks: every entry on every published daily Top 200, credited to its lead artist’s MusicBrainz-registered country, with Spotify’s aggregated Global chart excluded because it duplicates the country charts rather than adding to them.
Eight collection dates, 13 to 27 August 2026. The series has never read below 63.
Show the numbers
| Date | Markets with none |
|---|---|
| 2026-08-25 | 66 |
| 2026-08-27 | 65 |
| 2026-08-17 | 64 |
| 2026-08-20 | 64 |
| 2026-08-21 | 64 |
| 2026-08-22 | 64 |
| 2026-08-13 | 63 |
| 2026-08-24 | 63 |
Source: Computed from this desk's african-presence-over-time series, itself built from kworb.net Spotify daily country charts and MusicBrainz origin data, retrieved 27 Aug 2026 · download the data

A number this desk called stable was only half right#
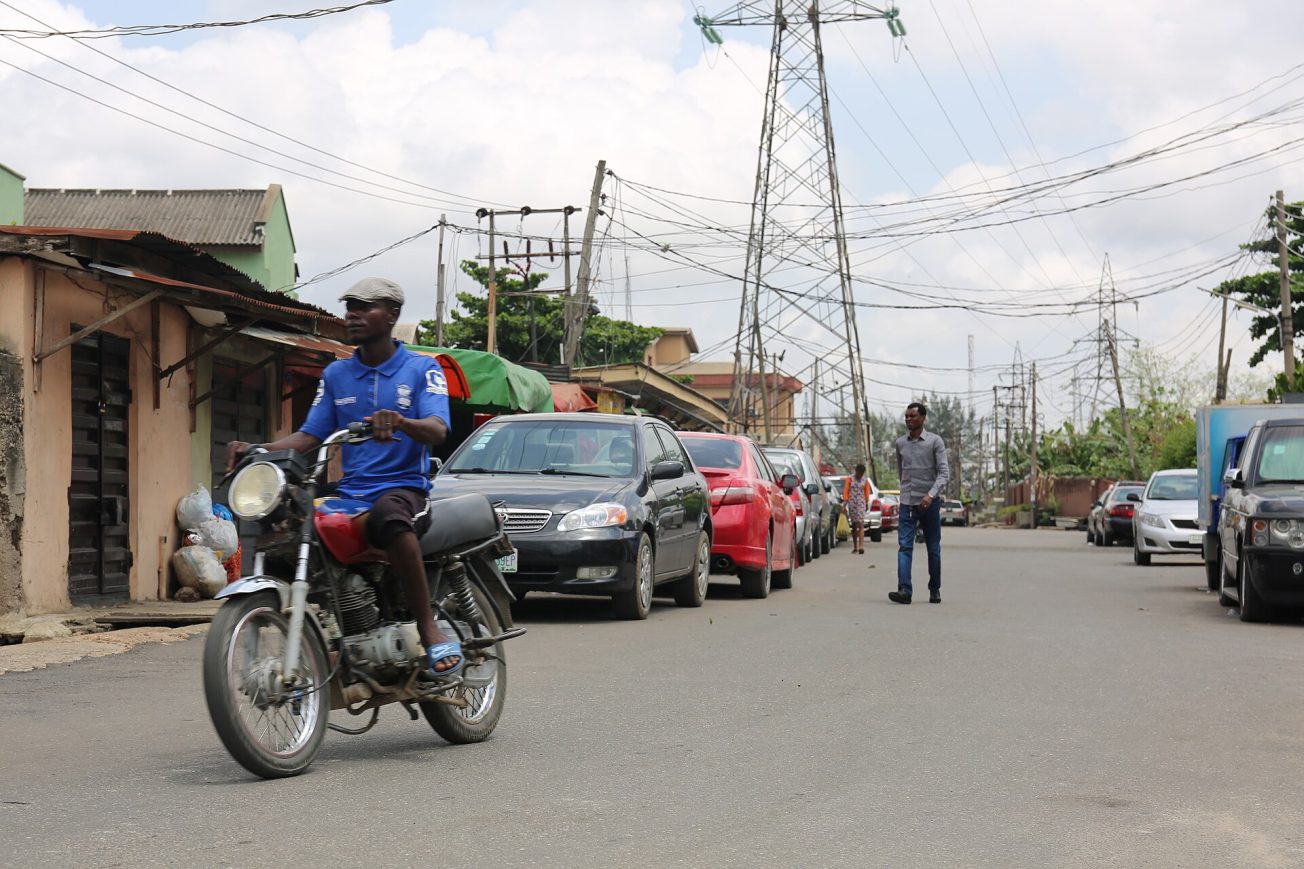
This desk first measured the gap on 13 August 2026 and reported it as 63 of 75. Eleven days later, on 24 August, an identical count, 63, appeared again. Reading only those two dates made the number look like a fixed structural fact about the platform rather than a moving one, an artefact of Spotify publishing charts for only four African markets, Nigeria, Egypt, Morocco and South Africa, while extending Top 200s to 71 other countries and territories where African artists mostly do not chart at all. The full eight-reading series says otherwise. On every one of the four dates between those two 63s, 17, 20, 21 and 22 August, the reading was actually 64, one worse. The number was not fixed at 63; 63 was the best reading in a series that mostly sat at 64 and once fell further.
On 25 August the count reached 66, the worst reading in the series, meaning only 9 of the 75 charts carried an African name that day. Two days later, on 27 August, it recovered to 65, still one worse than the 64 this series has mostly read and two worse than the 63 this desk originally reported. Across all eight collection dates, the count of markets carrying at least one African-origin artist has ranged from 9 to 12; the count carrying none has ranged from 63 to 66 and has never once read below 63.
| # | Date | Markets with an African artist | Markets with none | Share of the 75 with none, % |
|---|---|---|---|---|
| 1 | 2026-08-13 | 12 | 63 | 84 |
| 2 | 2026-08-17 | 11 | 64 | 85.30 |
| 3 | 2026-08-20 | 11 | 64 | 85.30 |
| 4 | 2026-08-21 | 11 | 64 | 85.30 |
| 5 | 2026-08-22 | 11 | 64 | 85.30 |
| 6 | 2026-08-24 | 12 | 63 | 84 |
| 7 | 2026-08-25 | 9 | 66 | 88 |
| 8 | 2026-08-27 | 10 | 65 | 86.70 |
Source: Computed from this desk's african-presence-over-time series, itself built from kworb.net Spotify daily country charts and MusicBrainz origin data, retrieved 27 Aug 2026 · download the data
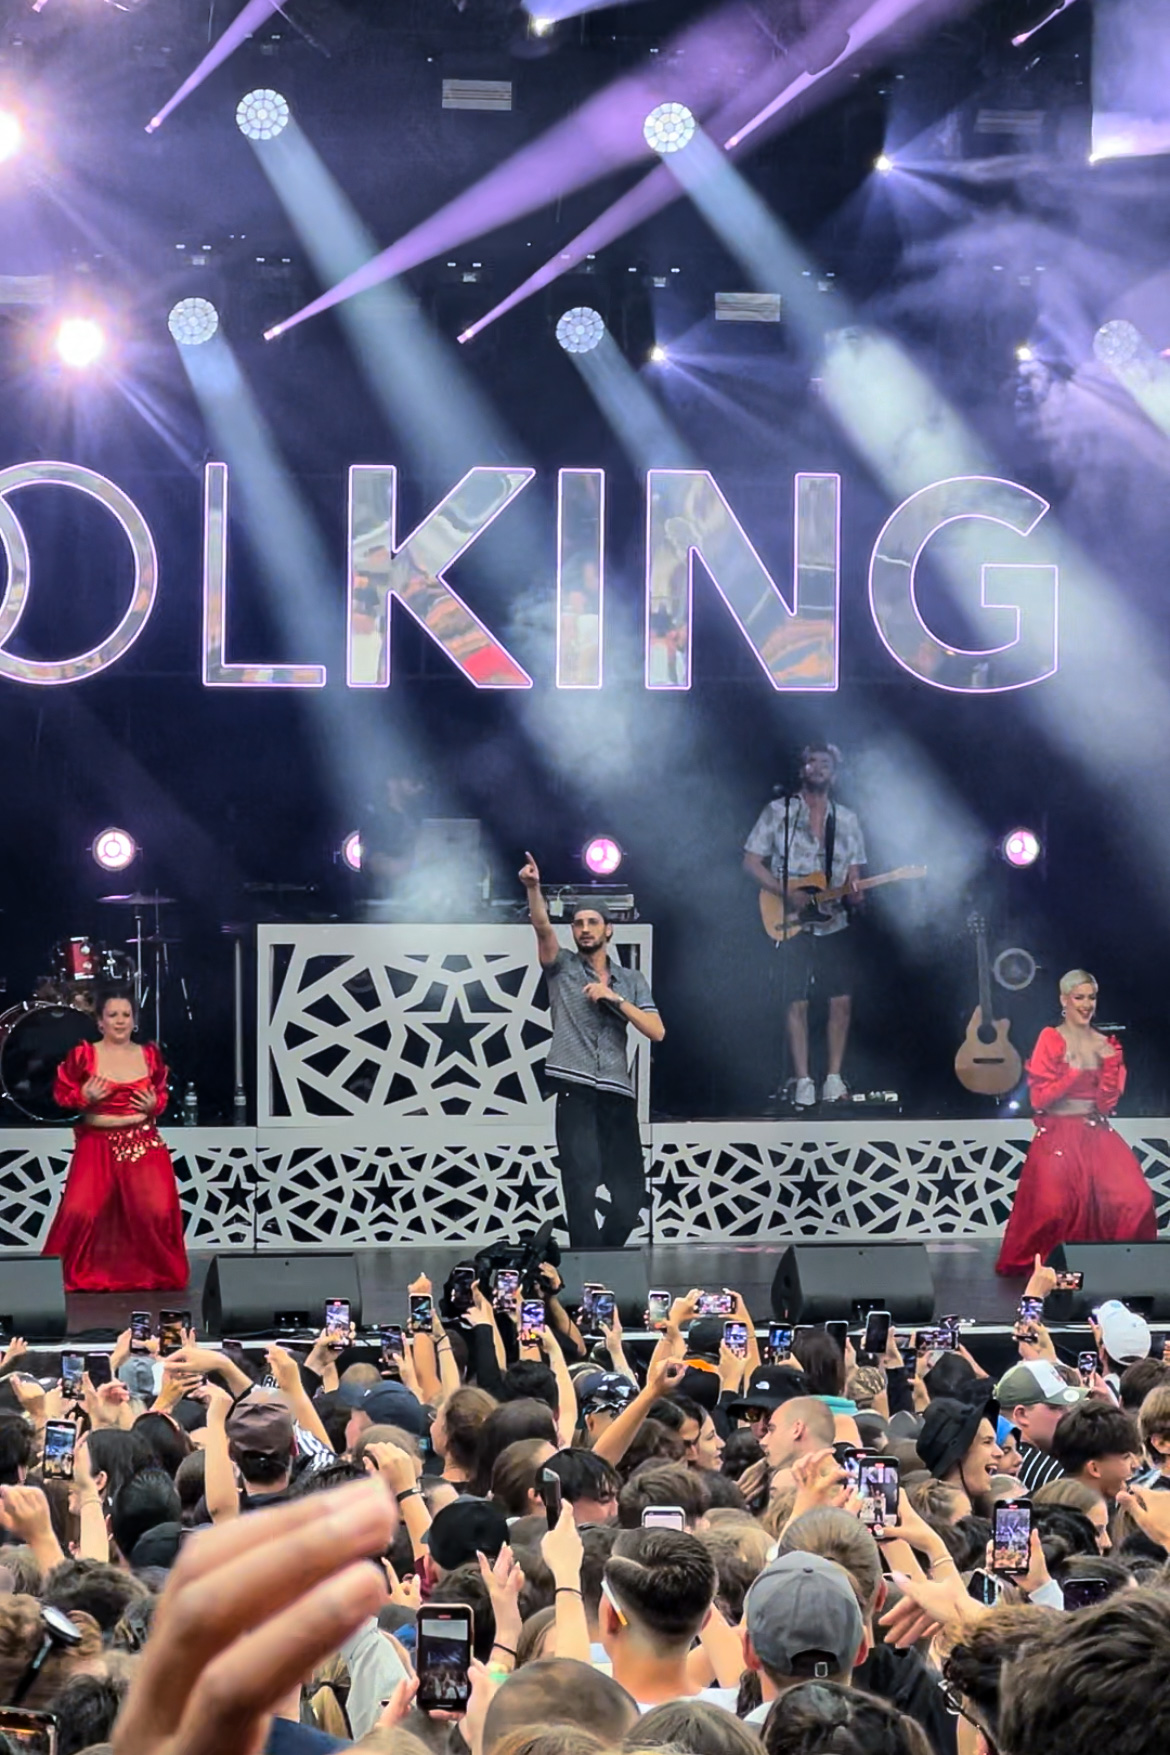
The 10 markets carrying an African artist today, 27 August, the only date this desk holds a full market-by-market breakdown for, are Nigeria (79.3% African by streams), Egypt (44.9%), Morocco (38.9%), South Africa (12.7%), Saudi Arabia (8.6%), Portugal (5.1%), the United Arab Emirates (1.8%), France (0.8%), Belgium (0.3%) and the Netherlands (0.3%). The first four are the markets Spotify itself publishes a chart for from an African country. What the one full snapshot shows about the other six: France’s African presence is split across two artists, not one, with Soolking supplying 56.7% of it; the Netherlands’ entire African presence, 28,230 streams, is a single Nigerian act, Victony; and Saudi Arabia’s 8.6% is carried by six Egyptian artists riding chart proximity into the wider MENA region rather than any one release.
The counter-reading#
The obvious objection is that 25 August was a bad day dragging an otherwise-typical run down, and that today’s 65 is the more representative figure. The data does not clearly support treating either day as the anomaly rather than the norm, and the robustness check on the column this finding rests on shows why: the absent-market count is bounded tightly, 63 to 66, a spread of only 3 across eight readings, so removing even the worst days cannot move the eight-day mean by much regardless of what is actually happening underneath. Dropping the single worst day, 25 August, brings the mean from 64.125 to 63.857, a change of under half a percentage point. Dropping the five highest readings, which removes every 64, 65 and 66 in the series bar one, still leaves a mean of 63.33, not the original 63. In a column this tightly bounded, a robustness check mostly demonstrates that the column is tightly bounded: with only eight points it cannot distinguish a genuine downward drift from ordinary day-to-day noise, and “the mean barely moves” should not be read as confirmation that 63 remains the right number to quote. What can be said without qualification is narrower: no reading in eight has come in below 63, and the two readings that did hit 63 are outnumbered by six readings that were worse.
| # | Scenario | Rows | Mean | Change in mean, % |
|---|---|---|---|---|
| 1 | All rows | 8 | 64.13 | 0 |
| 2 | Excluding the top 1 (2026-08-25) | 7 | 63.86 | -0.42 |
| 3 | Excluding the top 3 (2026-08-25, 2026-08-27, 2026-08-17) | 5 | 63.60 | -0.82 |
| 4 | Excluding the top 5 (2026-08-25, 2026-08-27, 2026-08-17, 2026-08-20, 2026-08-21) | 3 | 63.33 | -1.23 |
Source: Recomputed from spotify-african-market-absence-series, retrieved 27 Aug 2026 · download the data
A second, real limitation: this series only counts how many markets carry no African artist, not which ones flip in and out from day to day, because this desk’s individual daily market snapshots are pruned once the eight-date aggregate is updated, and only 27 August’s market-level detail survives. A market that drops out and back in within the eight-day window looks identical here to one that never appears at all, and this desk cannot say from the aggregate alone whether the same six smaller markets recur or whether different ones rotate through. Chart position is also not consumption: an African artist could hold a loyal audience in a market without cracking that market’s Top 200, and this measurement would show that as absence exactly as it would show a market with no African listeners at all.
What this means for artists and labels#
The practical read for an independent African act or label weighing an international release is not “the door is closed everywhere but four markets.” It is that the count of markets where the door is open at all, roughly 10 of 75 on the one date this desk can see in full, is not fixed: the aggregate series has moved across its entire observed range, from a high of 12 markets charting down to a low of 9, inside two weeks, and this desk cannot yet say from the data which specific smaller markets are doing the moving. What can be budgeted against with more confidence is the pattern visible in the one full snapshot this desk holds: a handful of named, specific routes, a Lusophone diaspora chart for an act like Calema, a French audience for an act like Soolking, MENA chart proximity for Egyptian acts reaching Saudi Arabia, rather than a general “going international” target. Which of the smaller markets are open on a given day looks like it depends on whether a release has a genuine claim on one of these specific routes, not on a stable base of importing markets an artist can plan a rollout around.