

Of the 749,769,170 Spotify daily chart streams that moved across the 75 markets this desk tracks on 2 October 2026, 696,727,504 of them, 92.9 per cent, passed through a market where not one charting lead artist resolved to an African country of origin. This is measured directly from kworb.net’s daily country charts for that date, cross-referenced against this desk’s own MusicBrainz-built artist roster: it is a count of charted stream volume credited to lead artists only, not of total streaming activity, not of featured credits, and not a projection.
ISO2 market codes. Chart streams are Top 200 totals for 2 October 2026; zero African-origin share means no charting lead artist resolved to an African country in this desk's roster that day.
Show the numbers
| Market (ISO2) | Top 200 chart streams, 2 Oct 2026 |
|---|---|
| US | 84.06m |
| ID | 67.94m |
| MX | 63.94m |
| IN | 61m |
| BR | 55m |
| PH | 40.42m |
| TR | 28.78m |
| GB | 21.86m |
| JP | 19.21m |
| DE | 18.29m |
| ES | 18.19m |
| IT | 15.09m |
| CO | 14.64m |
| AU | 13.7m |
| AR | 13.4m |
Source: Computed from this desk's spotify-african-share-by-market dataset (kworb.net Spotify daily country charts, artist origin from MusicBrainz), retrieved 2 Oct 2026 · download the data

Only eight markets carried any African share at all#
Sixty-seven of Spotify’s 75 published daily charts carried zero African-origin streams on 2 October. Eight did not. Those eight (Nigeria, Egypt, Morocco, South Africa, Saudi Arabia, the United Arab Emirates, Portugal and France) together carried 18,058,136 African-origin chart streams. That is smaller than the zero-share total of Turkey’s chart alone (28,777,911 streams) and about a fifth, 21.5 per cent, of the United States’ zero-share total (84,061,532).
| # | Market (ISO2) | Total Top 200 chart streams | African-origin chart streams | African share pct |
|---|---|---|---|---|
| 1 | FR | 21.02m | 64,622 | 0.31 |
| 2 | NG | 14.03m | 11.3m | 80.53 |
| 3 | EG | 6.43m | 4.87m | 75.82 |
| 4 | ZA | 4.61m | 740,660 | 16.05 |
| 5 | PT | 3.1m | 33,891 | 1.09 |
| 6 | MA | 2.04m | 885,934 | 43.51 |
| 7 | SA | 1.14m | 140,617 | 12.38 |
| 8 | AE | 679,455 | 20,819 | 3.06 |
Source: Computed from this desk's spotify-african-share-by-market dataset (kworb.net Spotify daily country charts, artist origin from MusicBrainz), retrieved 2 Oct 2026 · download the data
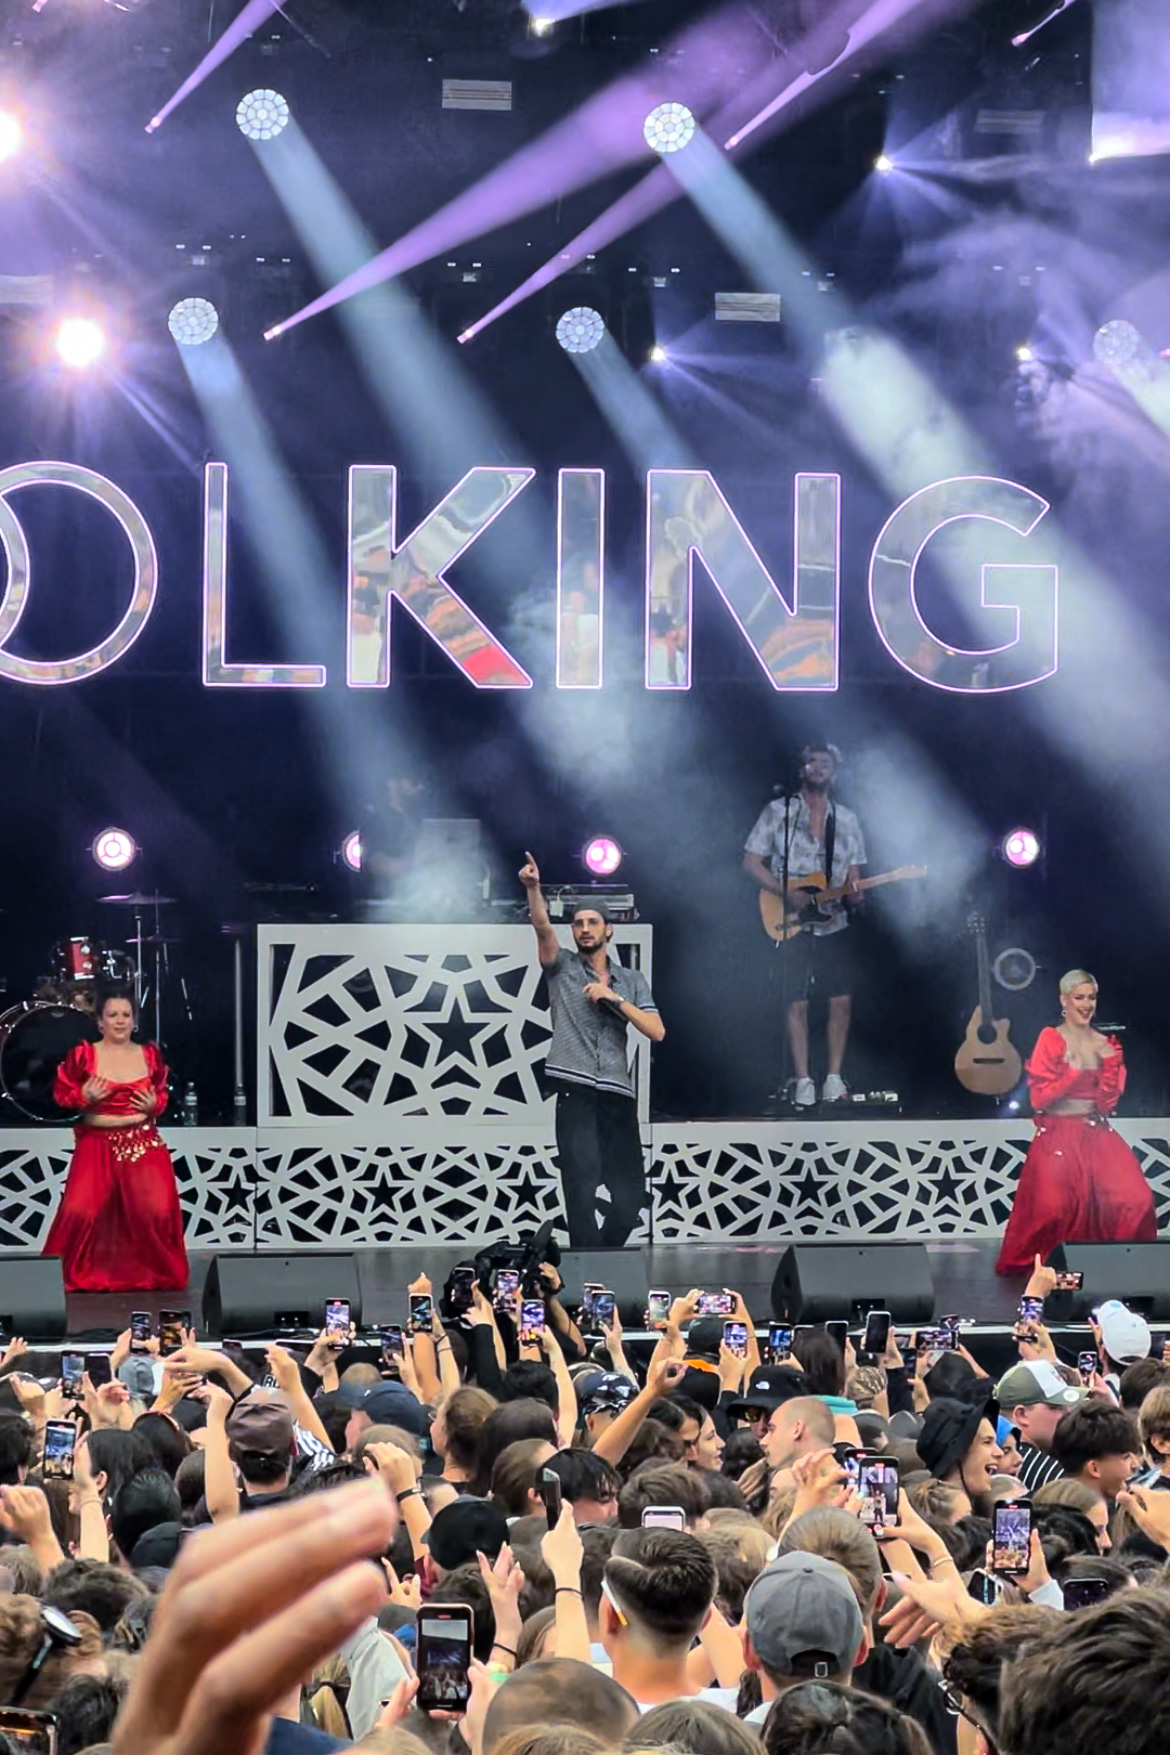
Market codes here are ISO2: ZA is South Africa, SA is Saudi Arabia, not to be confused with each other. France’s 64,622 streams are a single artist, Algerian rapper Soolking, whose music has no home chart to register on because Spotify does not publish one for Algeria.
This desk has not split the 18,058,136 by whether each stream landed on the artist’s own country chart, a different African country’s chart, or a market outside the continent entirely, and that distinction matters. A market total being nonzero and African is not the same as that stream having left Africa, and the eight-market table above should be read with that in mind rather than assumed to show clean exits from the continent.
| # | Scenario | Cross-border streams landing on an African chart | Cross-border streams landing outside Africa | In-Africa share, % |
|---|---|---|---|---|
| 1 | All 8 receiving markets | 350,295 | 332,224 | 51.32 |
| 2 | Excluding Nigeria | 115,481 | 332,224 | 25.79 |
Source: Computed from this desk's african-cross-border-chart-presence-04-september-2026 dataset, retrieved 2 Oct 2026 · download the data
That in-Africa share is itself a finding about one market. Nigeria’s chart received 234,814 of the 350,295 in-Africa cross-border streams that day, 67.0 per cent of that side. Pull Nigeria out and the in-Africa share falls from 51.3 to 25.8 per cent, roughly a quarter in, three quarters out, not an even split. Both scenarios date to 4 September 2026, not to the 2 October headline above.
The finding does not depend on one oversized market#
The headline number is a sum of 67 rows, and the three largest, the United States, Indonesia and Mexico, are each Spotify-scale markets on their own. Dropping them changes the picture less than the headline suggests.
| # | Scenario | Rows | Total | Change in total, % |
|---|---|---|---|---|
| 1 | All rows | 67 | 696.73m | 0 |
| 2 | Excluding the top 1 (US) | 66 | 612.67m | -12.07 |
| 3 | Excluding the top 3 (US, ID, MX) | 64 | 480.78m | -30.99 |
| 4 | Excluding the top 5 (US, ID, MX, IN, BR) | 62 | 364.78m | -47.64 |
Source: Recomputed from spotify-zero-african-share-markets-02-october-2026, retrieved 2 Oct 2026 · download the data
Pulling the five largest zero-share markets out entirely, the United States, Indonesia, Mexico, India and Brazil, still leaves 62 markets totalling 364,779,483 zero-share streams, 48.7 per cent of the entire 75-market chart volume for the day. Nearly half the world’s charted Spotify listening, even with its five biggest venues removed, still registered no African-origin lead artist at all on 2 October.
The table above recomputes the raw zero-share total after dropping rows; it does not restate the headline percentage. Doing that separately, by removing the same markets from both the zero-share volume and the whole 75-market panel, the 92.9 per cent headline moves to 92.0 per cent with the United States removed, 90.1 per cent with the three largest zero-share markets removed, and 87.3 per cent with the five largest removed. The share the piece leads with does not depend on any single market.
| # | Scenario | Remaining panel total | Remaining zero-share volume | Zero-share percentage |
|---|---|---|---|---|
| 1 | All 75 markets | 749.77m | 696.73m | 92.90 |
| 2 | Excluding the top 1 (US) | 665.71m | 612.67m | 92 |
| 3 | Excluding the top 3 (US, ID, MX) | 533.82m | 480.78m | 90.10 |
| 4 | Excluding the top 5 (US, ID, MX, IN, BR) | 417.82m | 364.78m | 87.30 |
Source: Computed from this desk's spotify-african-share-by-market and spotify-zero-african-share-markets-02-october-2026 datasets, retrieved 2 Oct 2026 · download the data
What this does and does not measure#
A market’s daily chart is a threshold, not a census: a market the size of the United States needs far more streams to seat an artist on its chart than a market the size of Portugal does, so a zero share does not mean zero African listening in that market, only that no African-origin artist cleared that specific chart’s specific bar that day. It also measures one day. And it measures charted lead-artist origin only, not featured credits, catalogue depth, or revenue, and the lead-only restriction is not a minor edge case: this desk has separately measured African artists’ featured-credit chart streams and found that measure reaches more markets and carries more volume than the lead-only count used here, but that wider reach has been concentrated in a small number of artists with major featured placements rather than spread evenly across the roster, so it does not reduce to a single stable multiple this piece can state as robust. A market counted as zero-share here can still be carrying an African feature credit; this piece does not measure that. It also measures market totals, not individual streams, so it cannot say how much of the volume on an African market’s chart is that market’s own artists versus artists crossing in from elsewhere in Africa, a distinction the 4 September cross-border figures above show is real but concentrated in one receiving market, Nigeria, rather than spread evenly. What it does measure cleanly is the shape of lead-credited evidence available to anyone citing “global reach”: on the day measured, that evidence sits inside eight markets out of 75, not the other 67, and a separate, featured-credit measure of reach would show more.
What this means for artists and labels#
If a pitch deck, a sync brief or a distribution offer cites “global Spotify performance” for an African catalogue, ask two things. First, lead or feature: a lead-artist claim of reach beyond eight markets, Nigeria, Egypt, Morocco, South Africa, Saudi Arabia, the UAE, Portugal or France, is not something this day’s chart data can support, but a featured-credit claim is a different, wider measure this piece does not cover: this desk’s own figures show that measure reaching more markets and more volume, concentrated in a small number of artists with major featured placements, which is not the same claim as an even, catalogue-wide spread. Second, if the claim is about a home market versus export, ask which: on the one date this desk has measured it, 4 September 2026, the in-Africa share of African cross-border movement was 51.3 per cent overall but fell to 25.8 per cent once Nigeria’s chart was excluded, so a single large receiving market, not a stable continent-wide pattern, is doing most of the work. Either way, an artist or label negotiating on the strength of “international streaming numbers” should ask for the specific market and the specific credit type, not the aggregate.